My 2021 master’s thesis at the University of Sarajevo was titled UAV Data Analysis: 2D and 3D Semantic Classification and Object Segmentation to Support Operators in Decision-Making.
The practical motivation was simple. A UAV mission can produce thousands of images. An operator cannot inspect every frame with the same speed and attention, yet the decision may depend on finding a blocked road, a changed object, or a relevant location.
The research covered 2D and 3D segmentation, geocoding, comparison of the same scene over time, and point-cloud processing.
The same scene is not the same data
Two images of the same place can differ because of:
- illumination;
- shadows;
- camera position and calibration;
- depth and perspective;
- weather and surface appearance;
- compression and image metadata.
That sounds obvious, but it is easy to forget once an image becomes an array. A pixel value is not a stable description of an object. It is a measurement produced by the scene, light, sensor and processing pipeline.
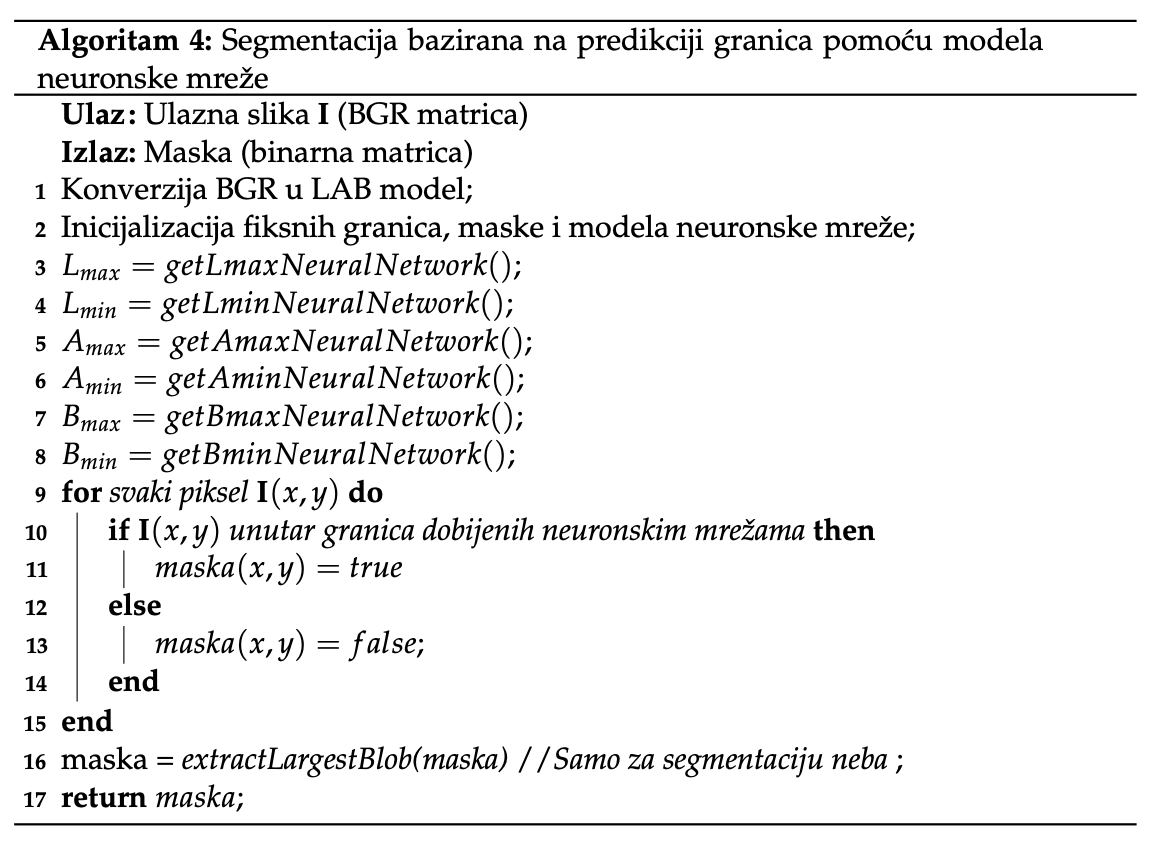
The 2D work compared several approaches, including fixed thresholds, Niblack-style local thresholds, linear-regression boundary prediction and neural-network boundary prediction. The purpose was not to declare one technique universally best. It was to see how their assumptions behaved on the available images.
Evaluation needs a reference
Segmentation is a weakly defined problem until someone specifies what the correct mask should be.
For evaluation, the thesis used manually created reference segmentations and compared results using intersection over union together with execution time. That combination mattered: a useful operator-support system needs both a quality measure and a practical runtime.
The broader data-quality lesson is familiar. If the reference labels are inconsistent, the final metric is also inconsistent. Model evaluation inherits the quality of the ground truth.
Moving from images to a point cloud
The 3D part reconstructed a dense point cloud from 54 camera views. The generated dense model contained 4,557,950 points and took 16 minutes and 6 seconds to process on the documented test machine.
The segmentation first separated ground and objects using a plane model and RANSAC. The ground points were then divided further using color information into road and green-surface classes.
This reduced some 2D problems, especially illumination, shadow and missing depth, but introduced different assumptions. The ground was treated as a plane, which is useful in the test scene but is not a universal property of terrain.
Assumptions are part of the output
That is the part of the thesis I still use in commercial work.
A result is not complete when it contains only labels, scores or a map. It should also state:
- what was measured;
- which transformation was applied;
- which assumption made the method possible;
- where the method is likely to fail;
- how the result was checked.
This is true for computer vision, geospatial data, CSV validation and business reports. The domain changes; the discipline does not.
What the thesis demonstrates
The work demonstrates implemented comparisons of 2D segmentation methods, scene-change analysis, reverse-geocoding integration, 3D reconstruction and point-cloud segmentation on the available research data.
It does not demonstrate a production UAV platform, universal accuracy across environments or a replacement for a human operator. It is a research foundation—and an honest example of why data, assumptions and evaluation belong in the same conversation.